© 2026. Randolph Hub. All Rights Reserved.
Welcome!
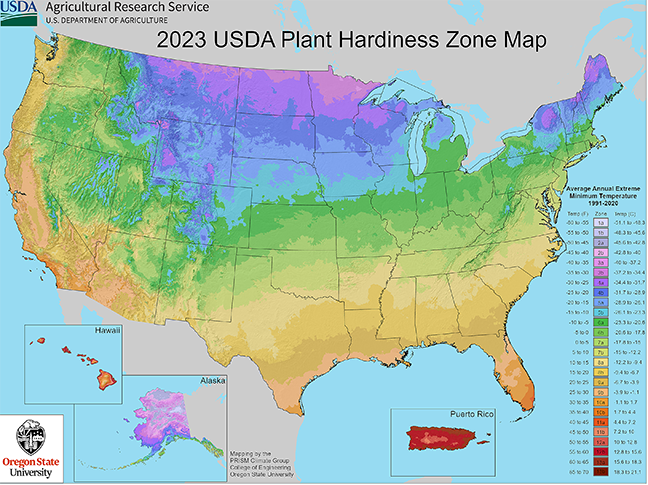
Here’s the latest Plant Hardiness Zone Map. Randolph is now in a large section of North Carolina in Zone 8a, a warmer zone than the previous 7b the county was in.
Is that a ray of warmth gardeners feel after rezoning?
ASHEBORO — On Nov. 15, the U.S. Department of Agriculture (USDA) released a new version of its Plant Hardiness Zone Map (PHZM). The last update was published in 2012.
Gardeners are familiar with this resource. It helps them determine which plants are most likely to survive the winter in their location by averaging the lowest temperature experienced over winter in any given area over a 30-year period. The information is then translated into 10-degree Fahrenheit zones and further divided into 5-degree Fahrenheit half-zones.
Randolph County falls in zone 8a, under the new map. It was previously in zone 7b. The researchers who developed the map noted that “about half of the country shifted to the next warmer half zone, and the other half of the coun-try remained in the same half zone. That shift to the next warmer half zone means those areas warmed somewhere in the range of 0-5 degrees Fahrenheit; however, some locations experienced warming in the range of 0-5 degrees Fahrenheit with-out moving to another half zone.”
What it means and doesn’t mean
To say that Randolph County is in zone 8 means the average lowest temperature during the winter here falls between 10-20 degrees Fahrenheit. To be classed as zone 8a means the average lowest temperature in our county tends to fall between 10-15 degrees Fahrenheit. In the 2012, when the county fell into zone 7b, the average lowest temperature was expected to be in the 5–10-degree Fahrenheit range.
Under the new map, this doesn’t mean the county will definitely experience a winter low of 10 degrees or that the county won’t slip even lower in temperature at some point during the winter. Everyone has heard the stories of (or experienced) prolonged stretches when the thermometer never climbed to the freezing mark during the day and hovered at 0 degrees or below for several nights in a row. The county has also had a few winters that weren’t so cold — times when despite a few nippy days and nights, the overall winter was relatively mild.
Researchers have been very keen to point out that the new map is not an indication of climate change. The average lowest winter temperature in any region is but one factor in the many that go into determining the extent of global warming. For example, researchers have noted that the new map indicates that the midwestern parts of the country have warmed more than the Southeast. There is more to understanding climate change than just the lowest average winter temperature.
Just as one can’t tell the general weather pattern by experiencing one season in an area, the new map can’t be used as a solid harbinger of what will happen this winter or the next or the next, etc. The average lowest temperature indicated by the map is more of a cautionary note and less of a guarantee.
The purpose of the plant hardiness map
What the map can do is give gardeners and commercial farmers guidelines on what plants are likely to do well in a particular area. Most plants sold to farmers and homeowners in the U.S. come with a plant information tag telling the buyer what zone the plant can live in, along with other cultural information. Implicit in that information is not just how much cold the plant can tolerate but also how much cold it needs.
Some folks may have tried their hand at forcing paperwhite bulbs for the holiday season. This involves nesting the bulbs in a bowl of decorative pea gravel and leaving them in a well-lit location at room temperature in the hopes that the bulbs will sprout and develop flowers in time for the holidays. Hint: if you want to try this for this holiday season, start now. It takes 4-6 weeks for the flowers to develop and open flower bulbs.
The same technique can be attempted with tulips but the bulbs will have to be stored in the refrigerator or some other spot that will average 40-45 degrees for at least 12 weeks. This is because paperwhites don’t need a period of cold dormancy; tulips do.
Cold dormancy is the number of hours a plant needs to develop leaves, flowers and/or fruit. This is also described as chilling units or hours. A chill unit is an hour of air temperature between 32-45 degrees Fahrenheit, minus all hours above 60 degrees. If the area’s average winter temperature has increased, it could be assumed that the number of chilling hours has decreased. This can determine whether certain spring flowering bulbs will give more than just foliage next season or whether a lilac will produce flowers at all, for instance. And it’s not just flowers and shrubs.
According to the N.C. Cooperative Extension office, “Most stone fruits (peach-es, plums, cherries) and pome fruits (apples, pears, quince) have a minimum chill requirement. Even some bush fruits, such as blueberries and blackberries, have specific chill requirements.”
This means, some plants that produced reliably in Randolph County in the past may no longer be suited for this area.
The problem is more critical for com-mercial farmers, as peach growers to the south of Randolph County can attest. If a plant doesn’t get the required chilling hours, it may still provide fruit but the harvest is likely to be decreased and of poor quality. Replacing peach trees with more resilient varieties takes time and patience. The average peach tree doesn’t produce well until it is at least 3 years old. Imagine having to replace an entire grove of peach trees and waiting three or more years for a return on investment.
We’ve been here before
Interestingly, this isn’t the first time Randolph County and other Piedmont counties have been listed in zone 8. According to LSU College of Ag Research Center, “The USDA Hardiness Zone Map has a history dating back several decades, and it has undergone multiple revisions to reflect the changes in climate knowledge and technology. The first version of the map was developed in 1938 by then-Sec-retary of Agriculture Henry Wallace.”
The first maps seem to have been produced for use by government researchers and agronomists and weren’t readily available to the average home gardener. In the government’s 1938 map, much of Piedmont North Carolina was in zone 8.
The earliest known plant hardiness map was put together in 1927 at the Arnold Arboretum, Harvard University, Boston, by Dr. Alfred Rehder. This one also categorized Randolph County as zone 8.